Contents
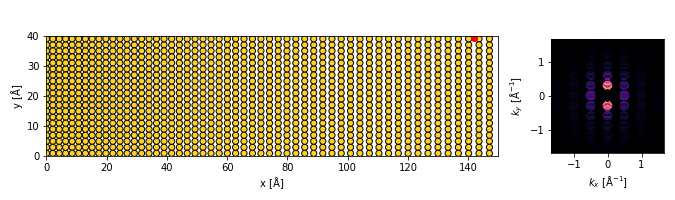
Strained Gold Widget
%matplotlib widget
import numpy as np
import ase
import abtem
import matplotlib.pyplot as plt
from matplotlib.gridspec import GridSpec
from scipy.spatial.transform import Rotation

import ipywidgets
import py4DSTEM

abtem.config.set({"dask.lazy":False});
def inside_cell(positions,cell_dim):
lx,ly,lz = cell_dim/2
x,y,z = positions.T
return np.logical_and.reduce(
(
x > -lx,
x < lx,
y > -ly,
y < ly,
z > -lz,
z < lz,
)
) # gold = ase.build.bulk("Au",cubic=True,a=4)
cell_dim = np.array([150,40,40])
gold_unit_cell = ase.Atoms(
symbols="Au4",
scaled_positions=[
[0.25,0.25,0.25],
[0.75,0.75,0.25],
[0.75,0.25,0.75],
[0.25,0.75,0.75]
],
cell=[4,4,4],
pbc=True
)
strained_gold = gold_unit_cell * (40,10,10)
strained_gold.positions[:,0] *= 1+(strained_gold.positions[:,0]/cell_dim[0]/2)
strained_gold.translate(-strained_gold.cell.lengths()/2)
strained_gold = strained_gold[inside_cell(
strained_gold.positions,
cell_dim
)]
strained_gold.translate(cell_dim/2)
strained_gold.cell = cell_dimgrain = strained_gold.copy()
grain_visualize = strained_gold.copy()potential = abtem.Potential(
grain,
sampling=0.2,
slice_thickness=cell_dim[2],
).build(
)energy = 300e3
semiangle_cutoff = 3
probe = abtem.Probe(
semiangle_cutoff=semiangle_cutoff,
energy=energy,
).match_grid(
potential
)detector = abtem.PixelatedDetector(max_angle=None)array_to_mutate = [
np.array([25,20])
]pos = np.array(array_to_mutate)
custom_scan = abtem.CustomScan(pos)dp = probe.scan(
potential,
custom_scan,
detector
).crop(
max_angle=probe.cutoff_angles[0]
).block_direct(
)dpi = 72
with plt.ioff():
fig = plt.figure(figsize=(675/dpi,200/dpi),dpi=dpi)
gs = GridSpec(1, 2, figure=fig,width_ratios=[4,1])
ax1 = fig.add_subplot(gs[0])
ax2 = fig.add_subplot(gs[1])
abtem.show_atoms(grain_visualize,plane='xy',tight_limits=True,ax=ax1)
scatter = ax1.scatter(
pos[0,0],
pos[0,1],
color='r'
)
dp.show(
cmap='magma',
ax=ax2
)
dp_im = ax2.images[0]
gs.tight_layout(fig)
fig.canvas.resizable = False
fig.canvas.header_visible = False
fig.canvas.footer_visible = False
fig.canvas.toolbar_visible = True
fig.canvas.layout.width = '680px'
fig.canvas.layout.height = "235px"
fig.canvas.toolbar_position = 'bottom'
def update_plots():
""" """
pos = np.array(array_to_mutate)
custom_scan = abtem.CustomScan(pos)
dp = probe.scan(
    potential,
    custom_scan,
    detector
).crop(
    max_angle=probe.cutoff_angles[0]
).block_direct(
)
dp_im.set_data(dp.array)
scatter.set_offsets(pos)
fig.canvas.draw_idle()
return None
def onmove(event):
""" """
pos = np.array([event.xdata,event.ydata])
if pos[0] is not None:
array_to_mutate[0] = pos
update_plots()
return None
cid = fig.canvas.mpl_connect('motion_notify_event',onmove)
Nonefig.canvas