Contents
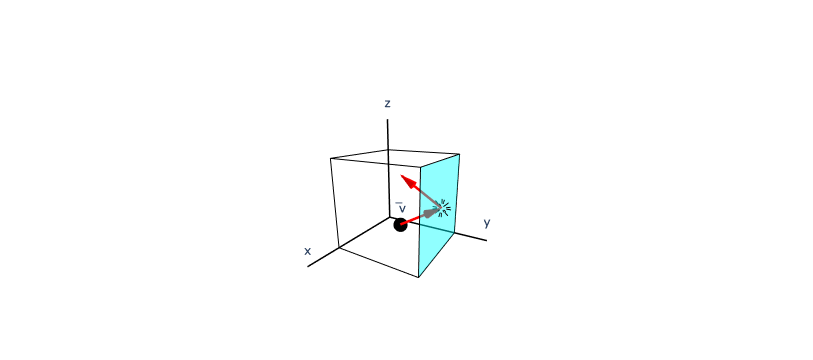
Gas molecule inside cube
Colin Ophus - 2024 Dec 19
import plotly.graph_objects as go# input variables
cube_size = 10
position = [5, 5, 2]
# Vectors for velocity and reflected velocity
vector_incident = [0, 5, 3] # Heading towards the right wall
vector_reflection = [0, -5, 3] # Reflecting back from the wall
# Create the plot
fig = go.Figure()
# Cube edges
for x in (0, cube_size):
fig.add_trace(go.Scatter3d(
x=[x, x, x, x, x],
y=[0, 0, cube_size, cube_size, 0],
z=[0, cube_size, cube_size, 0, 0],
mode='lines',
line=dict(color='black', width=2),
))
for y in (0, cube_size):
for z in (0, cube_size):
fig.add_trace(go.Scatter3d(
x=[0, cube_size],
y=[y, y],
z=[z, z],
mode='lines',
line=dict(color='black', width=2),
))
# Cube face
fig.add_trace(go.Mesh3d(
x=[0, cube_size, cube_size, 0],
y=[cube_size, cube_size, cube_size, cube_size],
z=[0, 0, cube_size, cube_size],
i=[0, 1, 2, 3], # Define indices for the vertices to form a face
j=[1, 2, 3, 0],
k=[2, 3, 0, 1],
# color='rgb(0,0.7,1.0)',
color='cyan',
opacity=0.25,
name='Cube Face'
))
# gas molecule
fig.add_trace(go.Scatter3d(
x=[position[0]],
y=[position[1]],
z=[position[2]],
mode='markers+text',
marker=dict(size=8, color='black'),
text=['\u0305v'], # Unicode for overline (velocity symbol)
textposition='top center',
name='Gas Molecule'
))
# Add incident vector as a line with cone arrow
fig.add_trace(go.Scatter3d(
x=[position[0], position[0] + vector_incident[0]*0.95],
y=[position[1], position[1] + vector_incident[1]*0.95],
z=[position[2], position[2] + vector_incident[2]*0.95],
mode='lines',
line=dict(color='red', width=5),
name='Incident Vector'
))
fig.add_trace(go.Cone(
x=[position[0] + vector_incident[0]],
y=[position[1] + vector_incident[1]],
z=[position[2] + vector_incident[2]],
u=[vector_incident[0]],
v=[vector_incident[1]],
w=[vector_incident[2]],
sizemode='absolute',
sizeref=2,
anchor='tip',
name='Incident Arrow',
showscale=False,
colorscale=[[0, 'red'], [1, 'red']]
))
# Add reflection vector as a line with cone arrow
fig.add_trace(go.Scatter3d(
x=[position[0] + vector_incident[0], position[0] + vector_incident[0] + vector_reflection[0]*0.95],
y=[position[1] + vector_incident[1], position[1] + vector_incident[1] + vector_reflection[1]*0.95],
z=[position[2] + vector_incident[2], position[2] + vector_incident[2] + vector_reflection[2]*0.95],
mode='lines',
line=dict(color='red', width=5),
name='Incident Vector'
))
fig.add_trace(go.Cone(
x=[position[0] + vector_incident[0] + vector_reflection[0]],
y=[position[1] + vector_incident[1] + vector_reflection[1]],
z=[position[2] + vector_incident[2] + vector_reflection[2]],
u=[vector_reflection[0]],
v=[vector_reflection[1]],
w=[vector_reflection[2]],
sizemode='absolute',
sizeref=2,
anchor='tip',
name='Incident Arrow',
showscale=False,
colorscale=[[0, 'red'], [1, 'red']]
))
# Add x, y, z axes
extend = 4
fig.add_trace(go.Scatter3d(
x=[0, cube_size+extend], y=[0, 0], z=[0, 0],
mode='lines+text',
line=dict(color='black', width=3),
text=['', 'x'],
textposition='top center',
name='X-axis'
))
fig.add_trace(go.Scatter3d(
x=[0, 0], y=[0, cube_size+extend], z=[0, 0],
mode='lines+text',
line=dict(color='black', width=3),
text=['', 'y'],
textposition='top center',
name='Y-axis'
))
fig.add_trace(go.Scatter3d(
x=[0, 0], y=[0, 0], z=[0, cube_size+extend],
mode='lines+text',
line=dict(color='black', width=3),
text=['', 'z'],
textposition='top center',
name='Z-axis'
))
# Add "starburst" at collision point
collision_point = [position[0] + vector_incident[0], position[1] + vector_incident[1], position[2] + vector_incident[2]]
burst_length = (0.5,1) # Adjust length of starburst rays
# Directions for the 8 rays (diagonals included)
s = 0.707
directions = [
(-1, 0, 0), (1, 0, 0), # ±x
(0, -1, 0), (0, 1, 0), # ±y
(0, 0, -1), (0, 0, 1), # ±z
(s, s, 0), (-s, -s, 0),
(s, 0, s), (-s, 0, -s),
(0, s, s), (0, -s, -s),
(s, -s, 0), (-s, s, 0),
(s, 0, -s), (-s, 0, s),
(0, s, -s), (0, -s, s),
]
# Add rays
for dx, dy, dz in directions:
fig.add_trace(go.Scatter3d(
x=[collision_point[0] + dx * burst_length[0], collision_point[0] + dx * burst_length[1]],
y=[collision_point[1] + dy * burst_length[0], collision_point[1] + dy * burst_length[1]],
z=[collision_point[2] + dz * burst_length[0], collision_point[2] + dz * burst_length[1]],
mode='lines',
line=dict(color='black', width=2),
))
# # Add "starburst" at collision point
# collision_point = [position[0] + vector_incident[0], position[1] + vector_incident[1], position[2] + vector_incident[2]]
# burst_length = 2 # Adjust length of starburst rays
# for dx, dy, dz in [(-1, 0, 0), (1, 0, 0), (0, -1, 0), (0, 1, 0), (0, 0, -1), (0, 0, 1)]:
# fig.add_trace(go.Scatter3d(
# x=[collision_point[0], collision_point[0] + dx * burst_length],
# y=[collision_point[1], collision_point[1] + dy * burst_length],
# z=[collision_point[2], collision_point[2] + dz * burst_length],
# mode='lines',
# line=dict(color='yellow', width=2),
# name='Starburst'
# ))
# Customize the layout
fig.update_layout(
scene=dict(
xaxis=dict(title='', showticklabels=False, showgrid=False, showbackground=False),
yaxis=dict(title='', showticklabels=False, showgrid=False, showbackground=False),
zaxis=dict(title='', showticklabels=False, showgrid=False, showbackground=False),
aspectratio=dict(x=1, y=1, z=1),
aspectmode='cube',
camera=dict(
eye=dict(x=1.2, y=0.7, z=0.4) # Adjusting the perspective
)
),
showlegend=False
)
# Show the plot
fig.show()
# import plotly.express as px
